Image by denamorado on Freepik

Introduction

Presentation of Zyra Expert Advisor: Combining Performance and Robustness

Our Zyra Expert Advisor (EA) is a proven swing trading solution designed to assist traders in making smarter trading decisions. What sets us apart in the market is our unique approach that incorporates multiple strategies simultaneously.

With sophisticated algorithms, Zyra constantly analyzes the market to identify trends and potential entry and exit points. We have individually tested and optimized each strategy using over 18 years of historical data to reduce the risk of curve fitting.

The robustness of our strategies is a crucial aspect for our clients. Unlike some risky EAs, Zyra does not employ strategies such as Grid or Martingale, which can lead to catastrophic losses. Each trade is equipped with a Stop Loss and Take Profit to ensure a Risk-Reward ratio of at least 2, minimizing the risk of loss.

We are proud to highlight that Zyra is designed to operate independently of brokers or VPS, and does not require a fast internet connection or expensive VPS. This allows our users to save on brokerage and VPS fees, while focusing on optimizing their trading strategy without worrying about system performance.

Zyra is designed to work on an H1 timeframe but also considers daily, weekly, and monthly periodicity data. With proper customization, you can choose which strategies to use for each currency pair you follow. Additionally, Zyra does not require regular updates to adapt to market conditions, allowing you to spend more time making the right trading decisions.

The robustness of our strategies has been verified through a series of rigorous tests. We conducted high precision tests using Dukascopy ticks, ensuring high accuracy in the quality of backtesting. Additionally, we performed Monte Carlo simulations to assess the resilience of our strategies to market variations and uncertainties. We also employed the Overcome Curve Fitting (OCF) method to evaluate the sensitivity of our strategies to excessive optimization.

These comprehensive tests aim to eliminate strategies that are too dependent on historical data and strengthen the probability of an effective long-term strategy. However, it is important to note that past performance does not guarantee future results, and trading always carries risks.

At Zyra, we are committed to providing a comprehensive and reliable solution to enhance our clients' trading performance. In addition to our Expert Advisor, we offer installation assistance and quality technical support. Our goal is to help our clients achieve a composite annual return rate of 10% with an annual risk limit of 5%, while ensuring simplicity and consistency in their trades.

Join us today and experience the benefits of Zyra Expert Advisor to enhance your trading journey. Keep in mind that trading involves risks, and it is important to exercise caution and manage risk appropriately. Our team is here to support you and help maximize your trading potential.

You can align the different versions between bronze, silver and gold.

All you have to do is choose which analysis you want to display.

Image by rawpixel.com on Freepik

Zyra Bronze V2

Zyra Bronze Version 2 comprises only 7 strategies, but these 7 strategies are also present in Silver and Gold, unlike Version 1. Diversification is not a primary feature in this version.

Risk = 10%

Report : Zyra Bronze V2 Risk=10% 2005 to 2023
Zyra Bronze V2 10% 2005-2023

The Zyra Bronze V2 10 portfolio has demonstrated commendable performance over an 18-year period while maintaining a 10% risk level. With a total profit of $62,675.96 and a profit of 43,092.7 pips, this portfolio showcases substantial returns.

The yearly average profit of $3,387.37 and an annual average percentage return of 483.91% highlight its ability to consistently deliver high returns year after year, while adhering to the 10% risk parameter.

A Compound Annual Growth Rate (CAGR) of 26.76% demonstrates impressive growth over the 18-year span, indicating robust and sustained performance that exceeds expectations and generates significant wealth.

Despite a relatively modest winning percentage of 48.82%, the portfolio maintains profitability with a profit factor of 1.36. This indicates that the portfolio has generated more profits than losses, revealing effective trade management and capital allocation.

The drawdown of $12,908.24, equivalent to 25.06% of the initial capital, emphasizes the portfolio's ability to withstand market fluctuations and recover from potential losses while remaining within the predetermined risk level.

The Sharpe ratio of 0.09 evaluates the risk-adjusted returns of the portfolio, indicating favorable returns given the level of risk. The return-to-drawdown ratio of 4.86 signifies that the portfolio has generated considerable returns relative to the drawdown experienced, reflecting a favorable risk-return profile.

A daily average profit of $9.59 and a monthly average profit of $282.32 underscore the portfolio's consistent profitability on a daily and monthly basis, providing a steady income stream.

Considering risk-adjusted returns, the portfolio has achieved an annual return-to-maximum-drawdown ratio of 1.07, indicating a favorable balance between risk and returns.

An R expectancy of 0.18 R reflects the average expected profit per unit of risk in each trade, signifying a positive return relative to the risk taken. The R Exp Score of 27.04 R measures the overall effectiveness of the portfolio in terms of risk management and profit generation.

The System Quality Number (SQN) of 2.68 and SQN Score of 1.11 suggest that the portfolio possesses a moderately high-quality trading system, with room for potential optimization and improvement in trading strategies to enhance performance and risk management.

In summary, the Zyra Bronze V2 10 portfolio has exhibited robust performance over an 18-year period, delivering substantial returns, consistent profitability, and effective risk management. Despite a relatively moderate winning percentage, its profitability and risk-adjusted returns demonstrate prudent risk management and capital allocation. There remains potential for further optimization to enhance performance, making Zyra Bronze V2 10 a compelling choice for traders seeking consistent returns with a 10% risk threshold.


Zyra Bronze V1

Zyra Bronze Version 1 provides a potent automated trading solution. The Bronze version is confined to 7 symbols, which can restrict diversification. This is where the hedging mode comes into play, activating 10 distinct strategies for each symbol, resulting in a total of 70 strategies. This enhanced diversification maximizes profit opportunities, even with a limited number of symbols. Experience peak performance with Zyra Bronze Version 1.

Hedging Risk = 10%

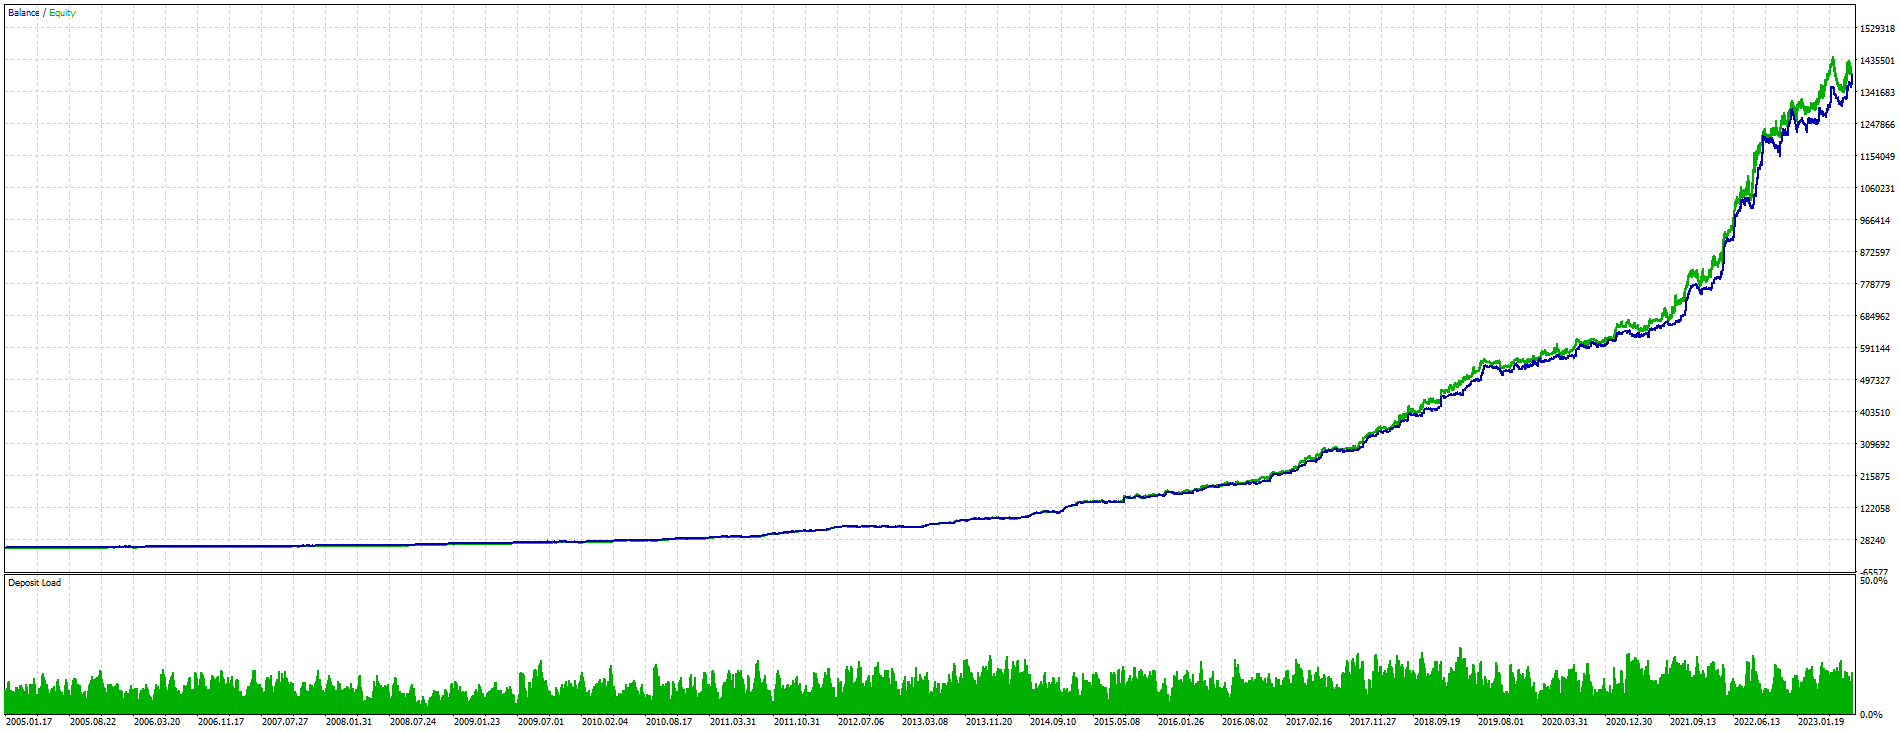
Report : Zyra Bronze Hedging Risk=10% 2005 to 2023
Zyra Bronze Hedging 10% 2005-2023

The Zyra_Bronze_10_2012-2023 portfolio has delivered remarkable performance over an 18-year period while maintaining a 10% risk level. With a total profit of $1,386,702.65 and a profit of 392,560.4 pips, the portfolio has generated substantial returns.

The annual average profit of $74,960 and the average annual return of 1,070.86% highlight the portfolio's ability to consistently achieve high returns each year, while adhering to the 10% risk parameter.

The compound annual growth rate (CAGR) of 32.13% reflects the impressive growth of the portfolio over the 11-year period, indicating strong and sustained performance that exceeds expectations and generates substantial wealth.

Despite a relatively low winning percentage of 34.22%, profitability is evident with a profit factor of 1.49. This suggests that the portfolio has generated more profits than losses, indicating effective trade management and capital allocation.

The drawdown of $69,600.09, equivalent to 8.84% of the initial capital, demonstrates the portfolio's ability to withstand market fluctuations and recover from potential losses. Although the drawdown is relatively high, it remains within the predefined 10% risk range.

The Sharpe ratio of 0.13 evaluates the risk-adjusted returns of the portfolio, indicating favorable returns given the level of risk. The return-to-drawdown ratio of 19.92 indicates that the portfolio has generated significant returns relative to the drawdown experienced, reflecting an advantageous risk-return profile.

The daily average profit of $205.32 and the monthly average profit of $6,246.41 highlight the portfolio's consistent profitability on a daily and monthly basis, providing a steady income stream.

When considering risk-adjusted returns, the portfolio has achieved an annual return-to-maximum-drawdown ratio of 3.63, demonstrating a favorable balance between risk taken and returns generated.

The R expectancy of 0.32 R indicates the average expected profit per unit of risk in each trade. The R Exp score of 327.67 R measures the overall efficiency of the portfolio in terms of risk management and profit generation.

With a System Quality Number (SQN) of 9.82 and an SQN Score of 9.88, the portfolio possesses a relatively high-quality trading system, although there is room for improvement.

In summary, the Zyra_Bronze_10_2012-2023 portfolio has exhibited strong performance over an 11-year period, delivering substantial returns, consistent profitability, and effective risk management. While the winning percentage may be relatively low, profitability and risk-adjusted returns demonstrate efficient risk management and capital allocation. There is still potential for further optimization to enhance performance.

OneShot Risk = 10%

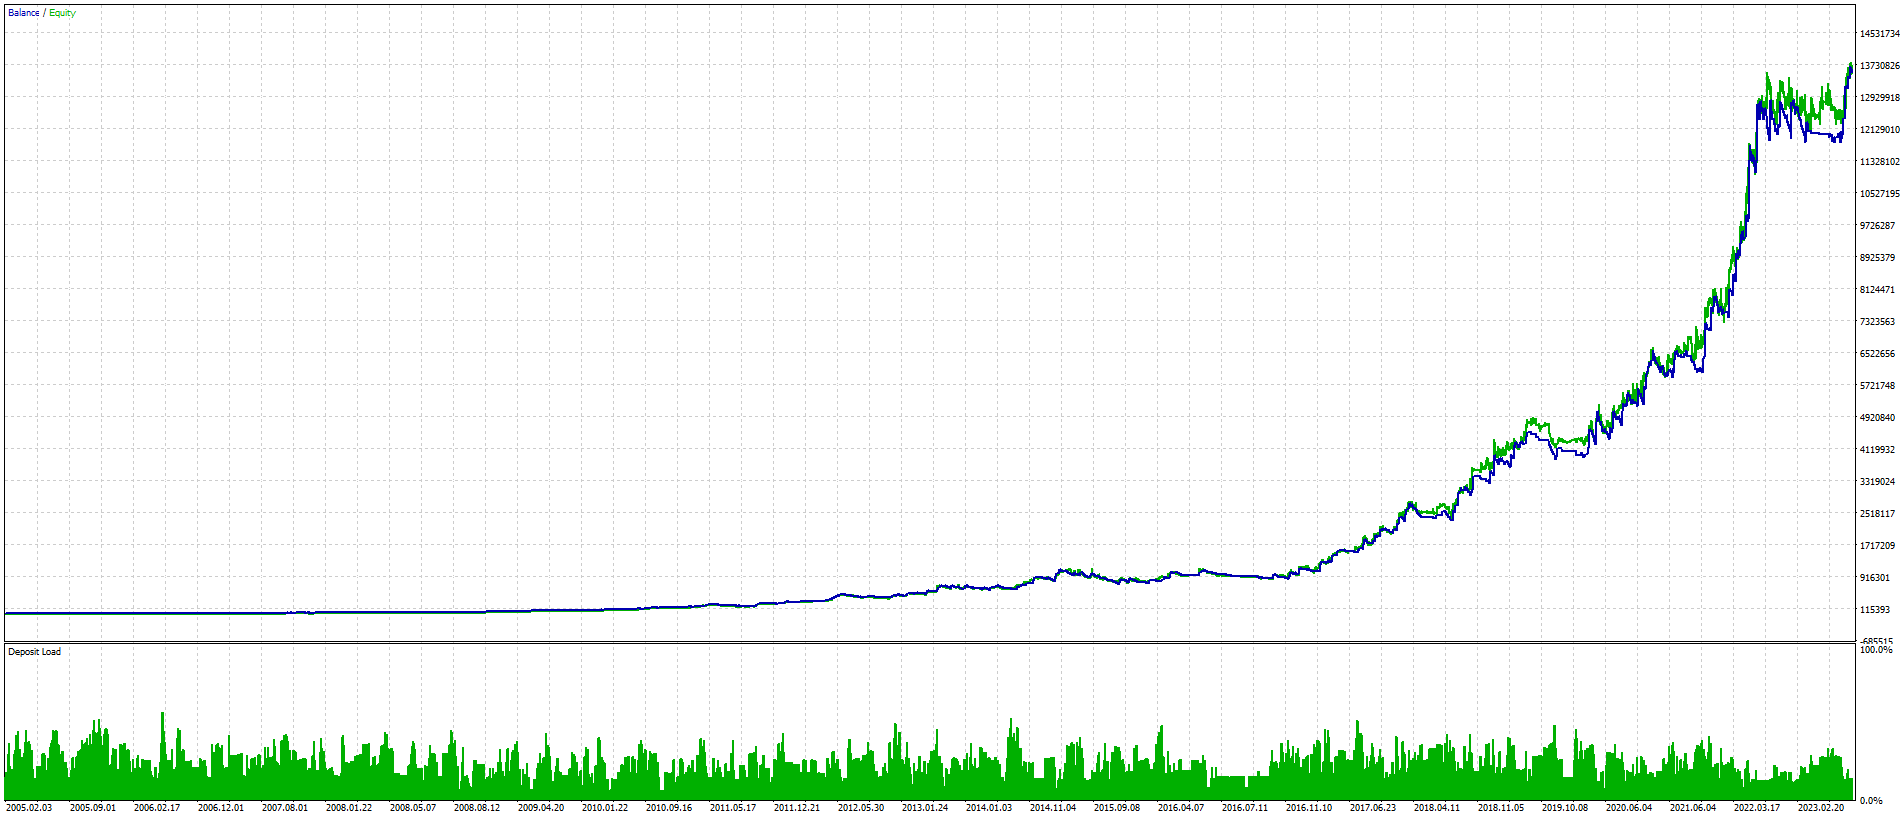
Report : Zyra Bronze One Shot Risk=10% 2005 to 2023
Zyra Bronze One Shot 10% 2005-2023

The Zyra_Bronze_OneShot_10_2005-2023 portfolio has demonstrated remarkable performance over the 18-year backtest period while maintaining a 10% risk level. With a total profit of $13,526,632.01 and a profit in pips of 49,220.9, the portfolio has generated substantial returns.

The yearly average profit of $730,949.56 and yearly average percentage return of 10,442.14% highlight the portfolio's ability to achieve consistent and high returns on an annual basis, while still respecting the 10% risk parameter.

The compound annual growth rate (CAGR) of 48.92% further demonstrates the impressive growth of the portfolio over the 18-year period. This indicates a strong and sustained performance, surpassing expectations and generating substantial wealth.

Despite the portfolio's relatively low winning percentage of 26.42%, the profitability is evident with a profit factor of 1.61. This suggests that the portfolio has generated more profits than losses, indicating effective trade management and capital allocation.

The drawdown of $1,072,645.57, representing 32.26% of the initial capital, showcases the portfolio's ability to withstand market fluctuations and recover from potential losses. Although the drawdown is relatively high, it is within the predetermined risk level of 10%.

The Sharpe ratio of 0.15 reflects the risk-adjusted returns of the portfolio. It indicates that the portfolio has delivered favorable returns given the level of risk taken, supporting the effectiveness of the risk management strategy.

The return-to-drawdown ratio of 12.61 signifies that the portfolio has generated considerable returns relative to the drawdown experienced. This indicates a favorable risk-return profile, suggesting that the portfolio has efficiently capitalized on profitable opportunities.

The daily average profit of $2,153.92 and monthly average profit of $60,930.77 highlight the consistent profitability of the portfolio on a daily and monthly basis, providing a steady income stream.

The average trade value of $6,556.78 indicates the average profit or loss associated with each trade. This suggests that the portfolio has executed trades with significant profit potential, contributing to the overall profitability.

Considering the risk-adjusted returns, the portfolio has achieved an annual return-to-maximum-drawdown ratio of 1.52. This indicates that for each unit of drawdown, the portfolio has generated 1.52 units of annual return, demonstrating a favorable risk-reward balance.

The R expectancy of 0.45 R indicates the average expected profit per unit of risk taken in each trade. This suggests that, on average, the portfolio can expect to achieve a positive return relative to the risk undertaken.

The R Exp Score of 50.44 R measures the overall effectiveness of the portfolio in terms of risk management and profit generation. A higher score indicates superior risk-adjusted returns and better performance.

The System Quality Number (SQN) of 3.58 and SQN Score of 1.41 suggest that the portfolio has a relatively lower quality trading system. This indicates the potential for further optimization and improvement of trading strategies to enhance performance and risk management.

In conclusion, the Zyra_Bronze_OneShot_10_2005-2023 portfolio has demonstrated strong performance over an 18-year period while adhering to a 10% risk level. The portfolio has achieved substantial returns, high annual average profits, and impressive compound growth. While the winning percentage may be relatively low, the profitability and risk-adjusted returns reflect effective risk management and capital allocation. The portfolio's ability to recover from drawdowns and consistently generate profits on a daily and monthly basis further highlights its stability. Overall, the portfolio shows promising potential, and continuous analysis, optimization, and risk management will contribute to further enhancing its performance.